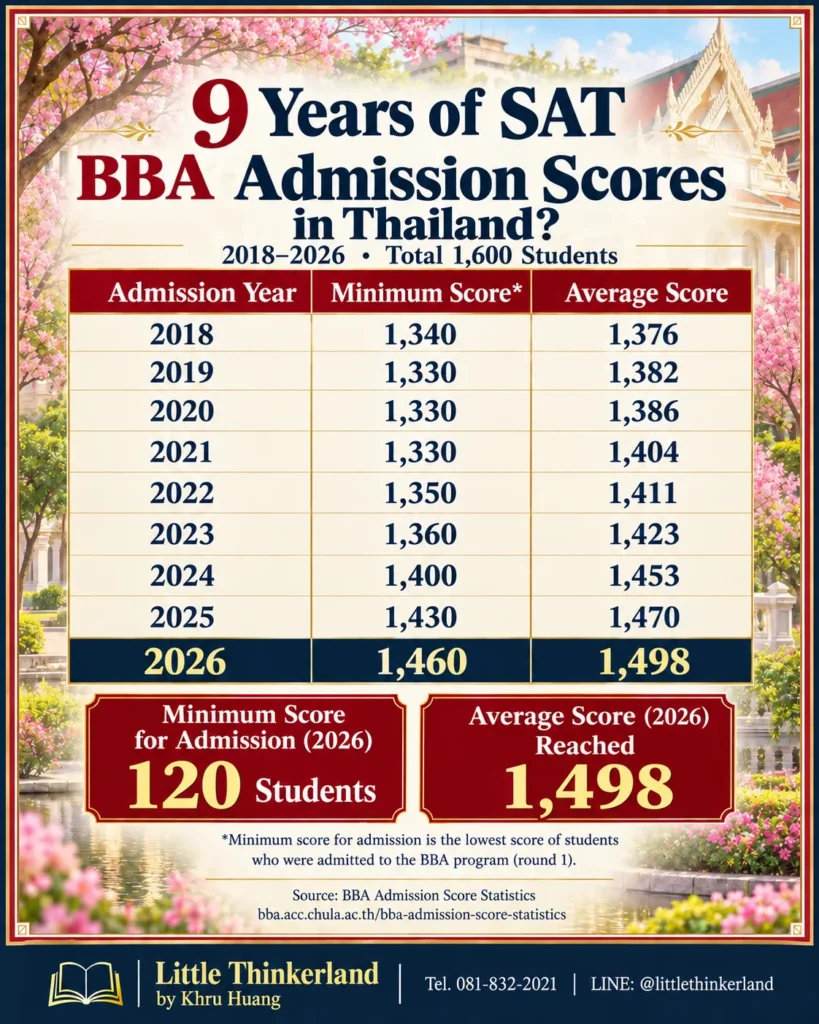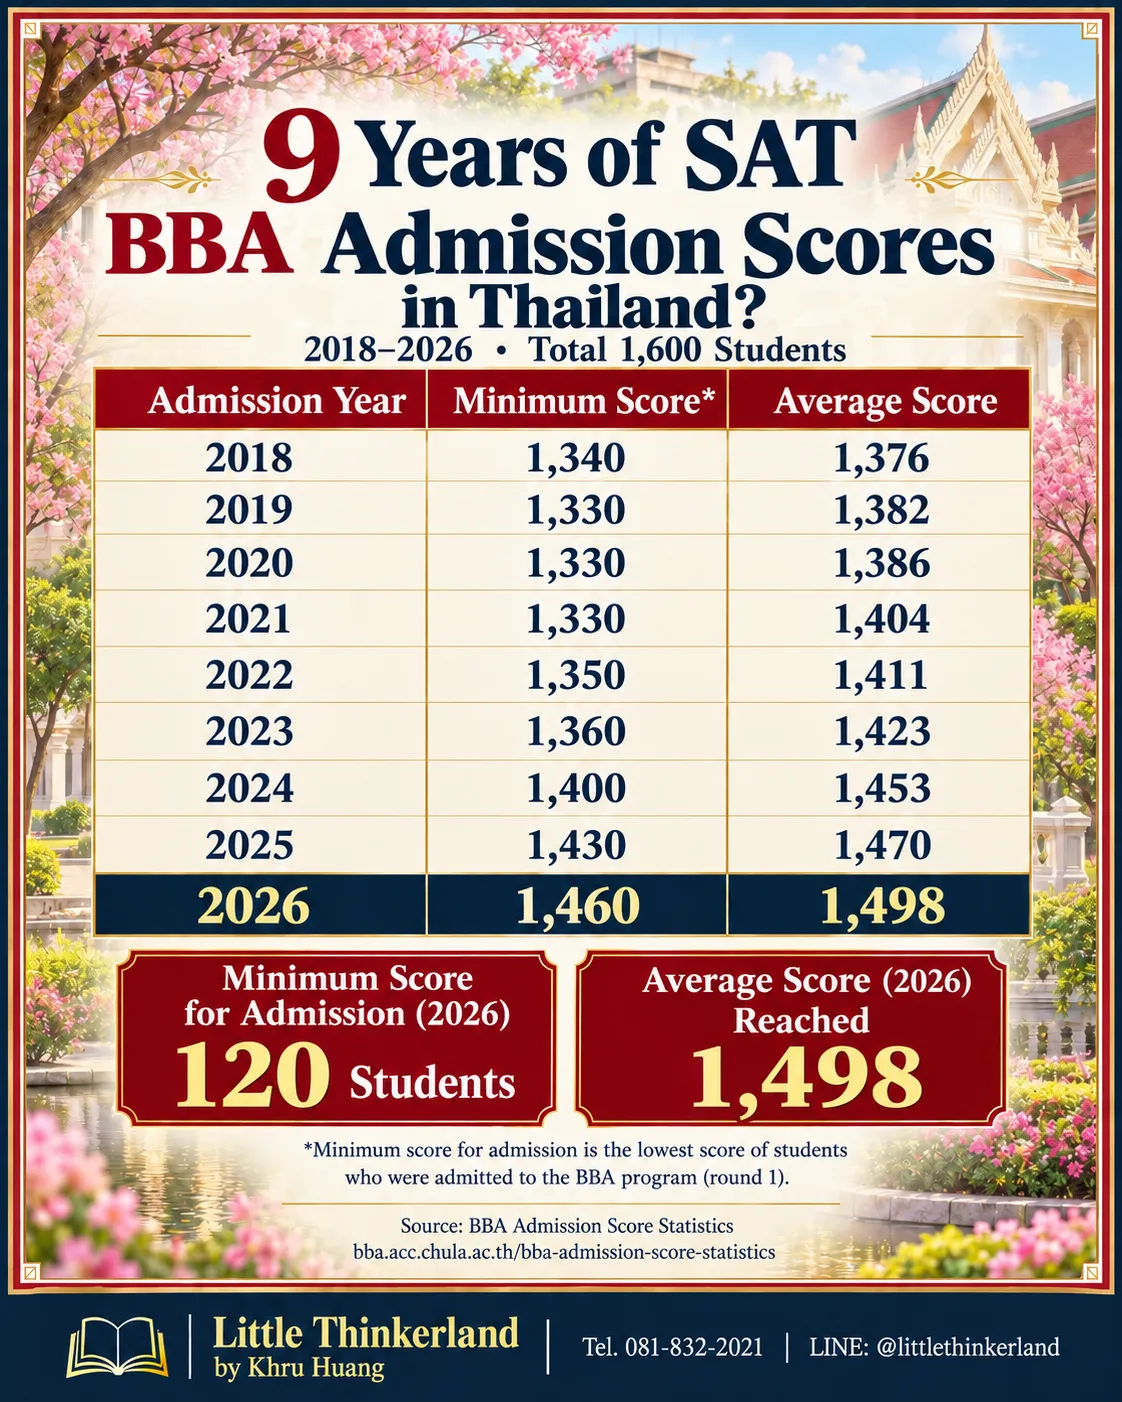
Looking at the statistics from 2018–2026, we can see that the average SAT score increased every year, rising from 1,376 to 1,498. Meanwhile, the lowest reported score increased from 1,340 to 1,460.
The most notable changes occurred between 2023 and 2026, when the lowest reported score rose from 1,360 → 1,400 → 1,430 → 1,460, representing a total increase of 100 points over three years.
These figures suggest that the SAT scores of students represented in the program’s published statistics have been rising. However, they are not enough to conclude that the SAT has become easier or predict how much scores will increase next year.
🎯 How Should Students Prepare?
Planning based solely on the minimum application score may not be enough. Students should review historical statistics, identify their own weaknesses, and allow sufficient time to improve their understanding, accuracy, and ability to complete the test within the time limit.
Even as the average score approaches 1,500, achieving this level is still a significant accomplishment. It also doesn’t mean every student needs to aim for the same target score.
Kru Huang hopes these insights will help students plan their preparation with greater clarity, without feeling that their scores define their worth. 💙
📌 Note: The lowest scores shown in the table are statistics published by the program, not minimum application requirements. The source does not distinguish between admission rounds, and historical scores do not guarantee future results.
Source: BBA Admission Score Statistics
Little Thinkerland by Khru Huang
📞 081-832-2021
LINE: @littlethinkerland
#BBACU #BBACUAdmission #SAT #StudyAbroadPlanning #LittleThinkerland